Dashboard Overview
Welcome to Puck Tools! This guide will help you get familarized with our dashboard.
Dashboard
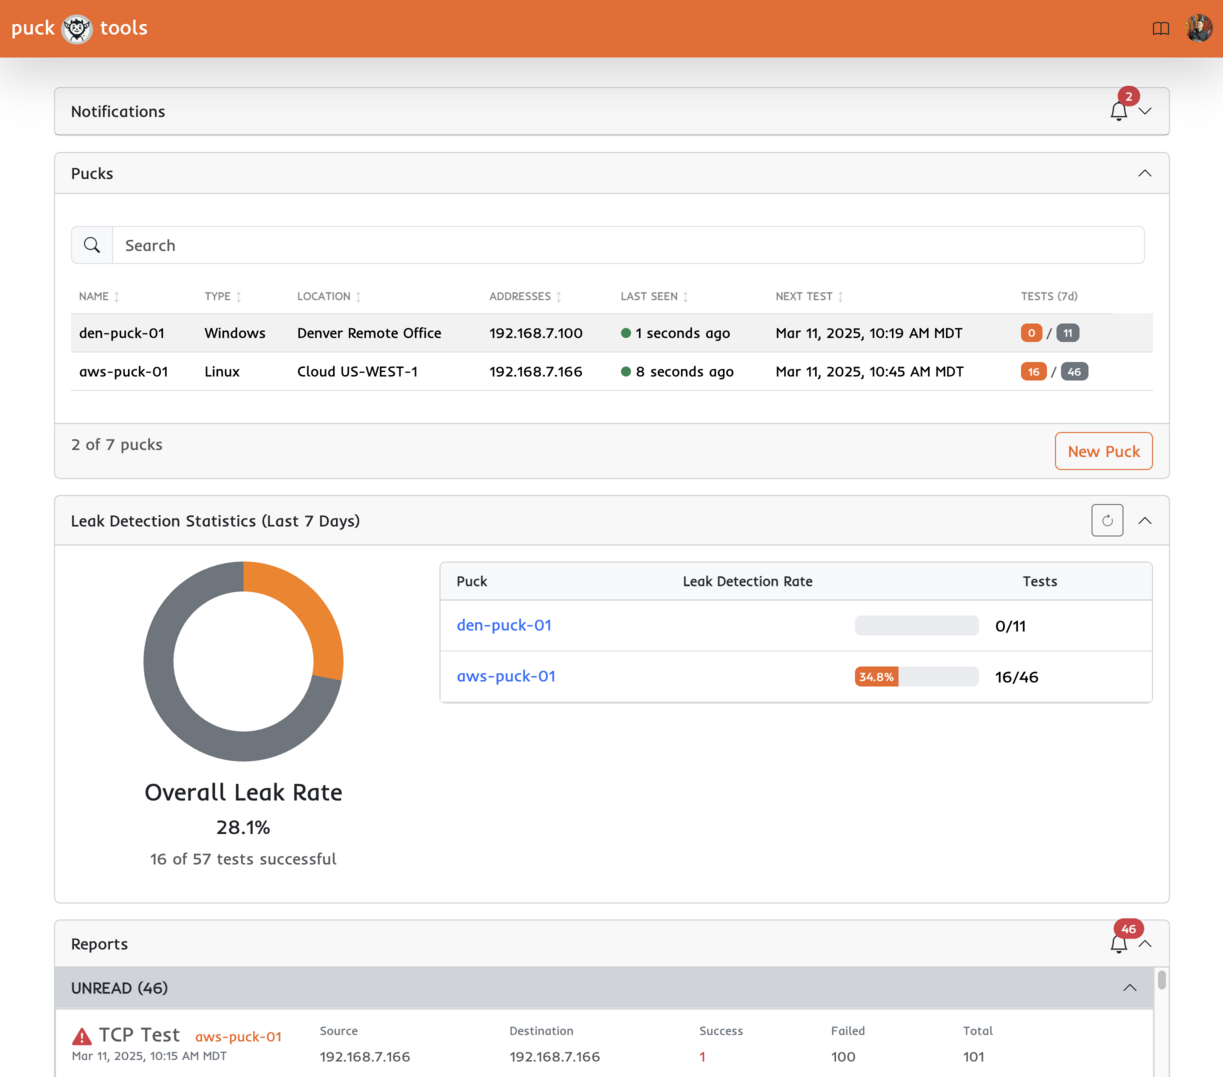
The puck dashboard is your centralized location to see notifications, reports and what pucks you have deployed.

Notifications
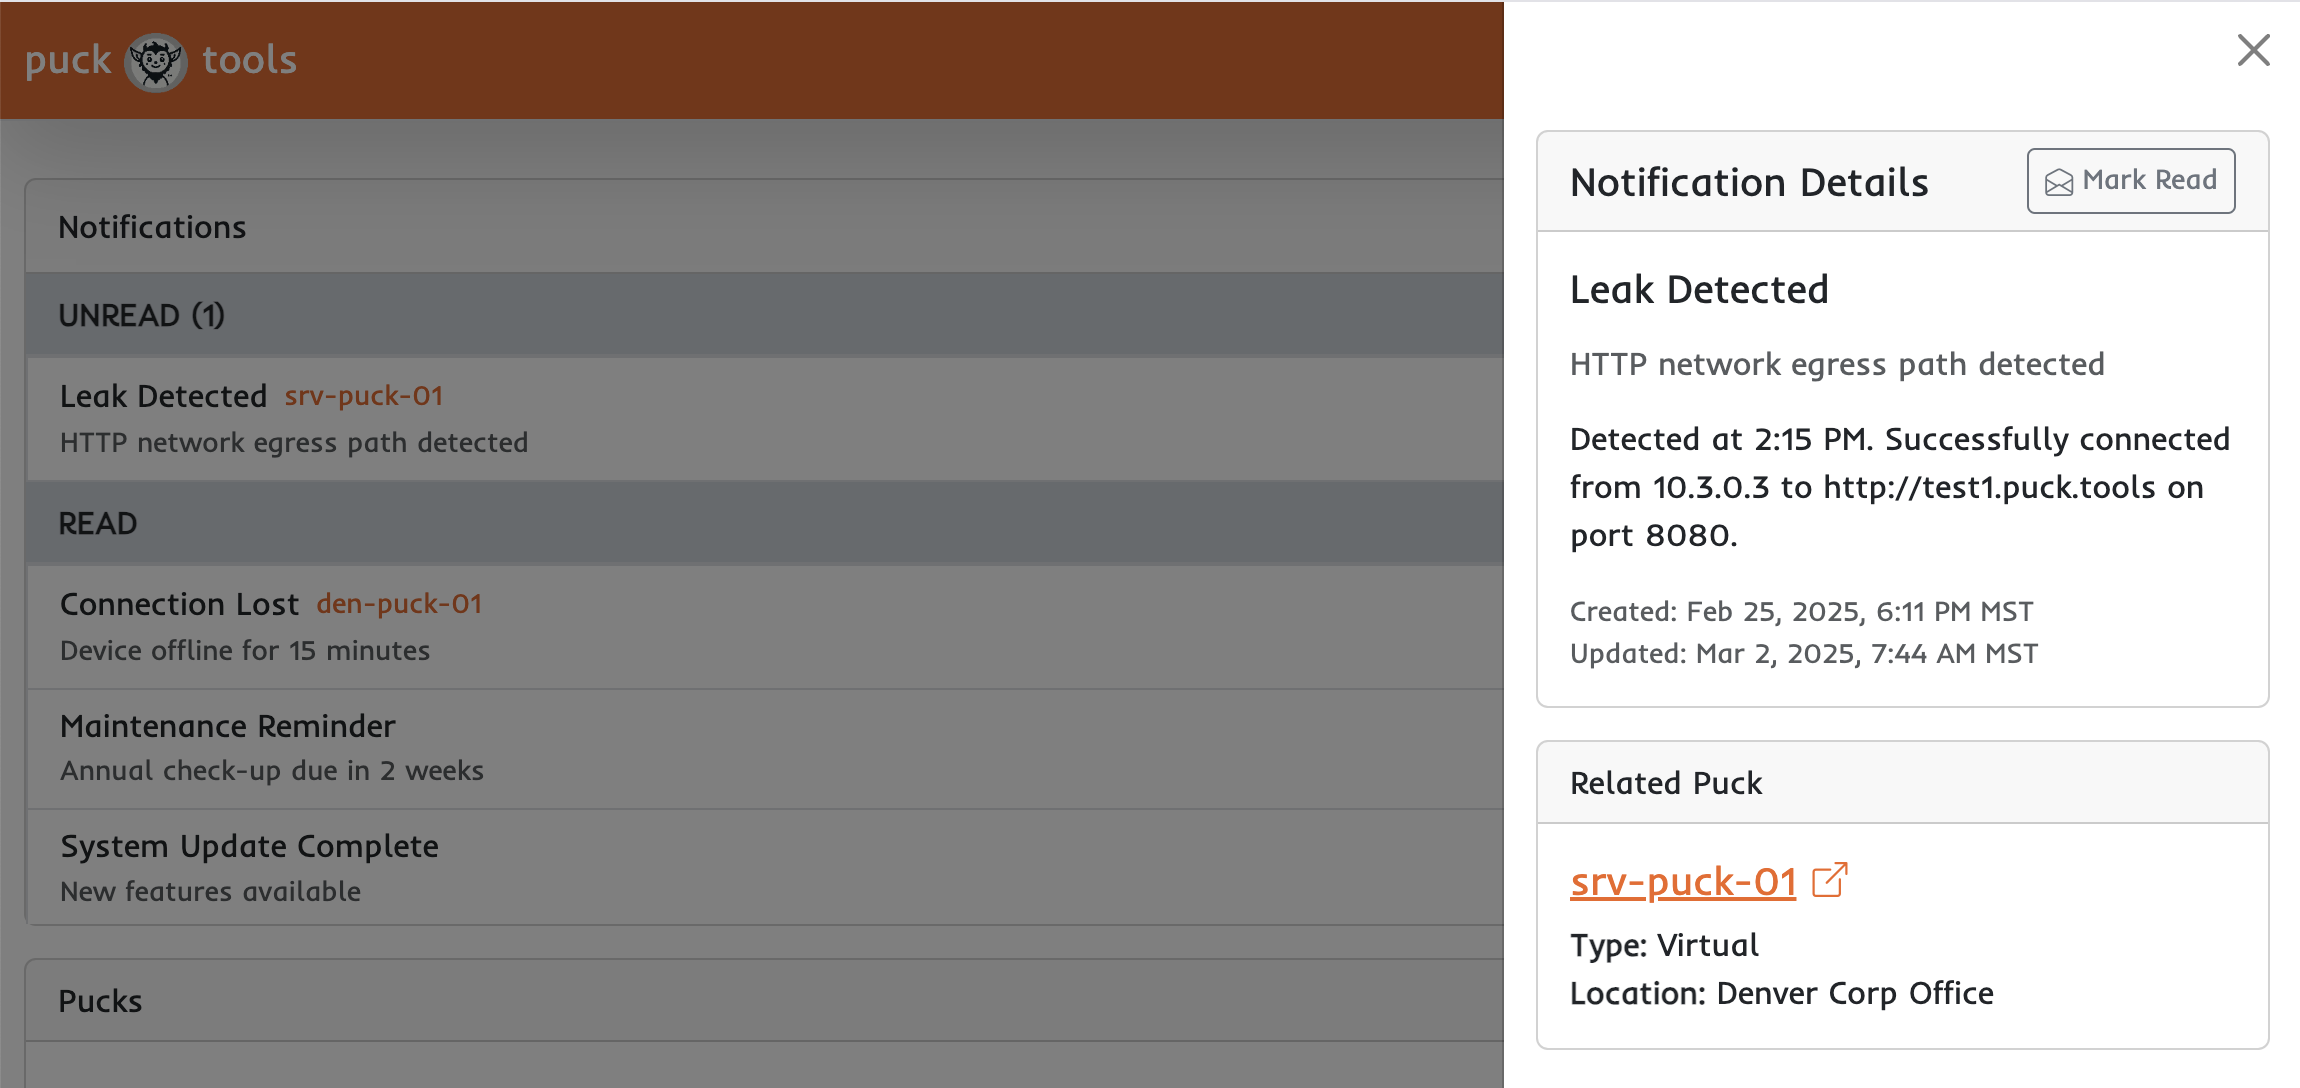
Notifications provide real-time updates about important events related to your pucks, such as connectivity issues or detected leaks. You can quickly scan through recent activities to stay informed about the status of your deployed devices. You can easily see the read status of events to know if you or someone on your team has already reviewed the event.

Puck List
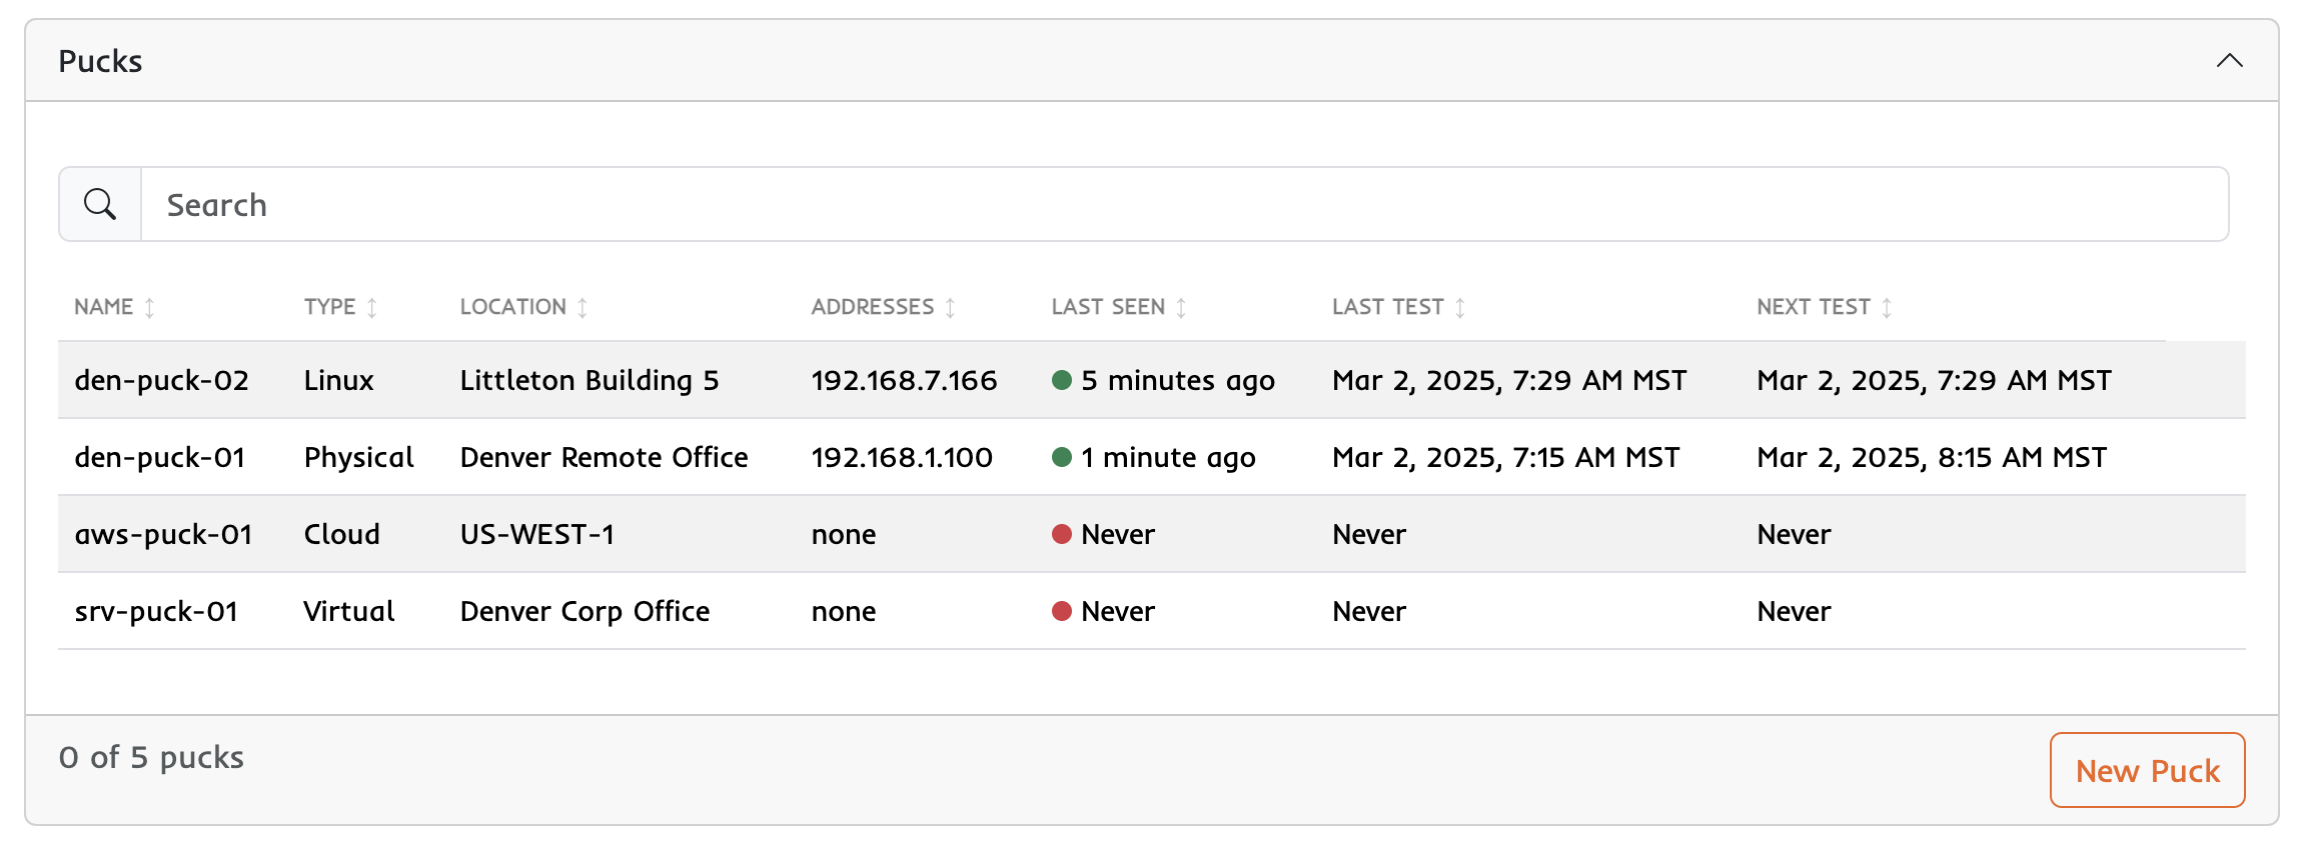
The Puck List provides a comprehensive overview of all your deployed pucks, allowing you to quickly assess their status, location, and last check-in times at a glance. You can easily add new pucks to your deployment by clicking the "New Puck" button, streamlining the process of expanding your monitoring network. Clicking on any puck will bring you to the Puck Details page.

Leak Detection Statistics
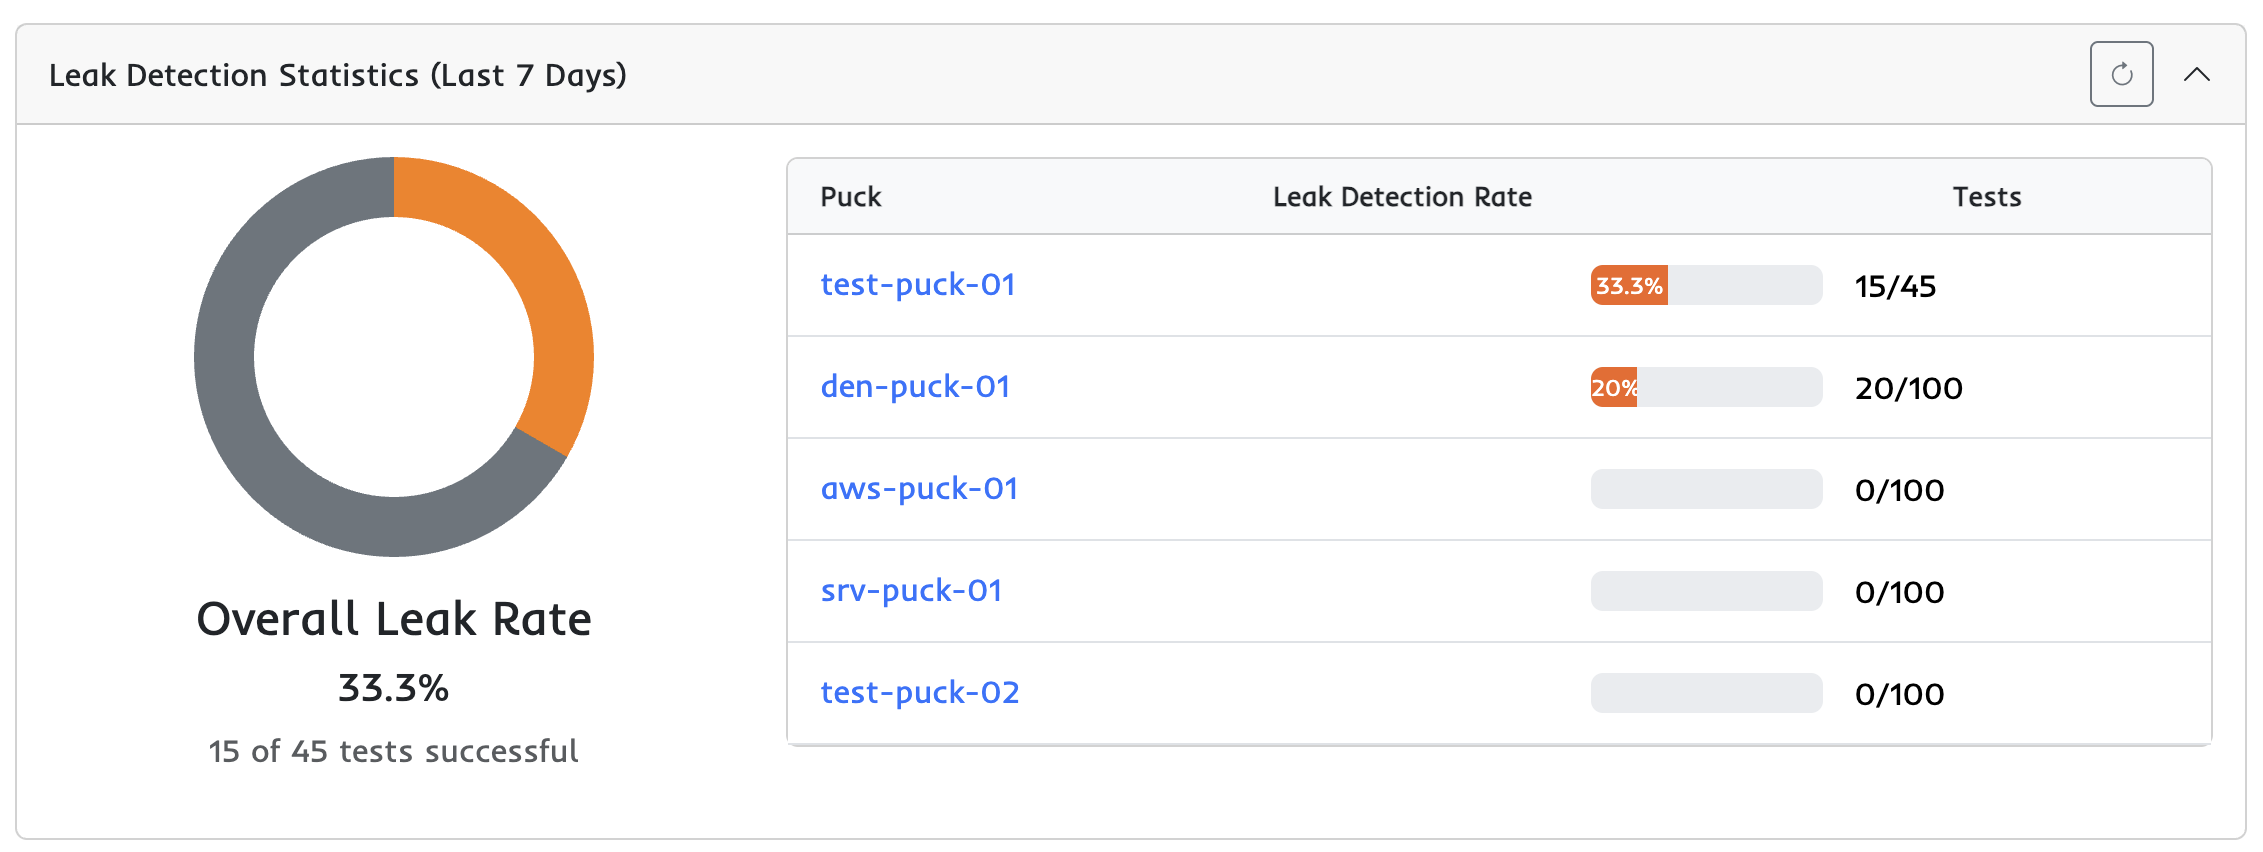
The Leak Detection Statistics sectino gives a summary of tests that have been conducted over the previous 7 days. This gives you a simple way to visualize tests that have happened and what may need attention.

Reports
The Reports section provides a quick snapshot of your most recent test results, displaying the status of all of the most recent tests in an easy-to-scan format. Clicking on any report will bring you to the Report Details page.

Calendar View
The Calendar View provides a visual timeline of all scan activity across your pucks, including completed scans, scheduled events, and projected future scans.
Week Navigation:
The calendar displays a 7-day week view with navigation controls:
- Previous: Move back one week
- Today: Jump to the current week
- Next: Move forward one week
Day Detail View:
Clicking on any day opens a detailed view showing all events for that date:
- Completed Scans: Shows a count badge of finished scans. Click to view the summary modal with pass/fail statistics.
- Scheduled Events: Displayed with a blue border, these are one-off scans you have scheduled to run at a specific time.
- Failed Events: Displayed with a red border, indicating scans that encountered errors.
- Projected Scans: Displayed with a dashed border and grouped by puck, these show future scan occurrences based on each puck's configured test period.
For more details on scheduling scans and understanding projected events, see the Scheduling documentation.